
Translation errors often carry risks. Their consequences range from minor misunderstandings to serious legal, financial, reputational, or health-related outcomes for end users, translation providers, clients, and other stakeholders. Risk mitigation requires evaluation to identify and quantify these risks.
MQM is a framework for analytic Translation Quality Evaluation (TQE). It can be used to evaluate human translation (HT), machine translation (MT), or AI-generated translation. MQM includes a set of error types and a scoring model. Error types are organized in a hierarchical system called the MQM Error Typology under seven high-level core error dimensions, together with subordinate error types and their associated severity levels. The scoring model features a system of weights and parameters assigned to the error types and severity levels, as well as a scoring formula used to calculate a numerical score that represents the quality of the evaluated translation according to agreed-upon specifications.
The evaluated text can comprise a selected sample or an entire document or set of documents. Evaluators frequently work with samples in the range of 500 to 20,000 words, depending on the size of the project and the resources available for evaluation.
1.1 Error Typology
As noted above, the MQM error typology is based on seven high-level dimensions, with subordinate error subtypes at various levels. For example, the Accuracy error dimension contains error subtypes such as Addition, Mistranslation, and Omission. The complete repository of all error types is known as MQM-Full. Implementers typically select a subset of MQM-Full to provide the granularity they need. MQM-Core is a pre-defined subset that comprises the seven core error dimensions with the selected error subtypes that are most widely used in the language sector. The error types are represented by a name and a rigorous description.
They have a specific, defined meaning and should not be understood as general language words or common terms. For instance, Accuracy in MQM refers to the appropriate correspondence between source and target language, rather than to factual correctness in general; and the concept of the Register error type is more limited than in general language and linguistics.
1.2 The Scoring Model
Implementers design their scoring models by selecting Error Types and subtypes applicable to the kinds of errors that are important to their evaluation projects based on project specifications. They assign Severity Levels and appropriate Error Type, which evaluators annotate in a translation environment or record in a scorecard. These values are used by the scoring formula to calculate a Quality Score.
The scoring calculation determines the final Quality Score. This kind of score can be calculated with or without calibration (see Methods for Calculating the Quality Score):
The Raw Scoring Model (Score without Calibration) works with the following values and parameters:
- The Evaluation Word Count (EWC)
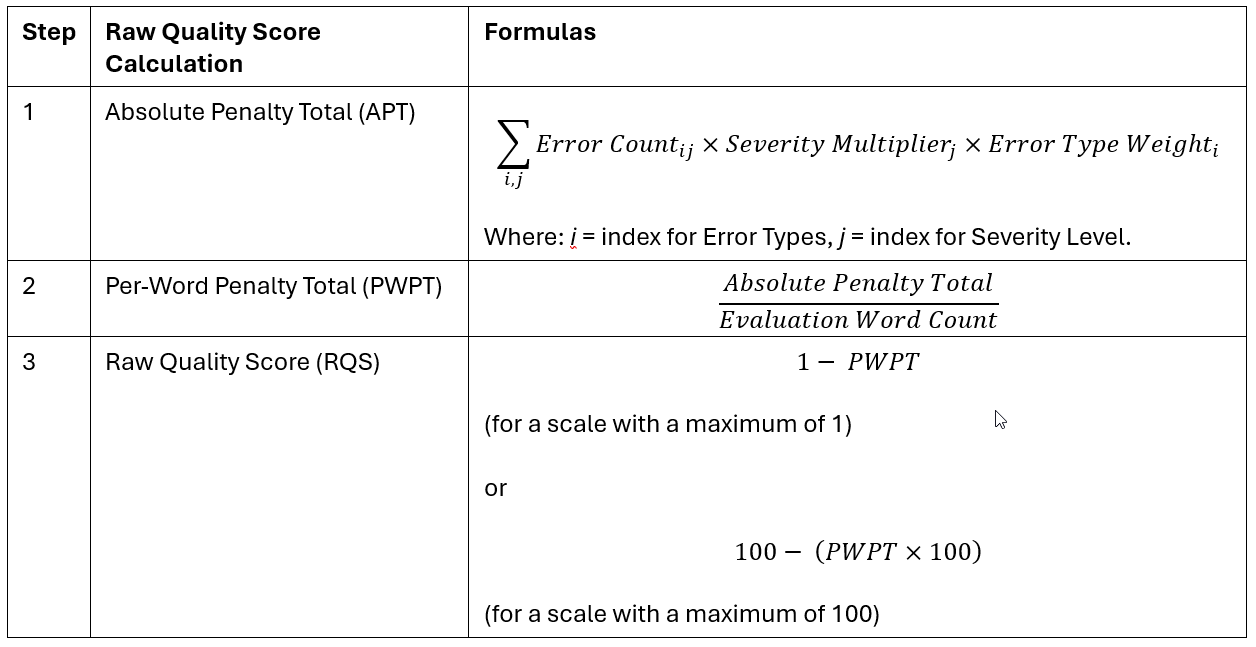
- The Absolute Penalty Total (APT) – i.e., the total of the penalty points calculated for the Evaluation Word Count. Penalty points are calculated based on the error counts reported for the individual Error Types under the individual Severity Levels. (Error-type penalties are explained under Error Type Weights. Severity-level penalties are explained under Severity Penalty Multipliers.)
- Maximum Score Value (MSV)
The Scoring Model with Calibration works with the same values and parameters as the Raw Scoring Model. A few additional parameters are required as explained in Score Calculation with Calibration.
A Passing Threshold or error tolerance value can be established to allow for the assignment of a Pass or Fail Rating. With calibration, setting a relevant quality threshold and error tolerance limit is much easier and more flexible, making the pass/fail decision clearer and more understandable. In addition, calibration allows adjustment of the scoring formula to match the perception of the rater.
1.3 The Process
The MQM evaluation process generally requires implementers to:
- Evaluate translation project specifications and analyze them with respect to end-user needs;
- Select Error Types from the MQM Error Typology that are appropriate to the defined specifications;
- Create an MQM metric, which they integrate into a scoring system in their tool environment or use to create a scorecard;
- Determine sample size and define sampling procedures.
Historically, translation evaluators have used spreadsheet-like scorecards (see Figure 1 below), but today evaluators are more likely to annotate errors and integrate scoring calculations directly in their translation environments. For the purposes of visualizing and describing the annotation and score-generation process, it is helpful to use a scorecard as an example. The sample scorecards used here represent useful options, but they are not normative.
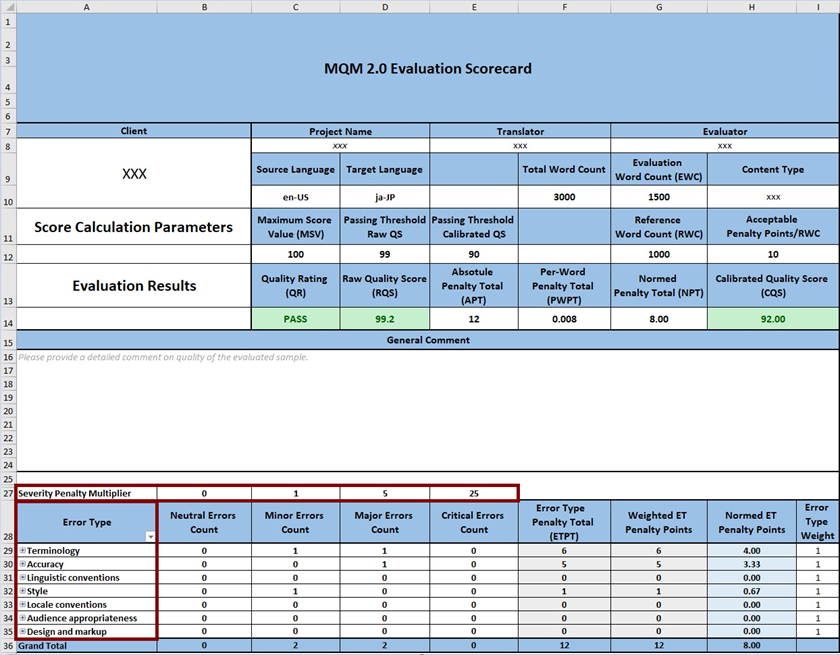
Figure 1: Sample MQM Scorecard featuring the 7 top-level error dimensions and Severity Penalty Multipliers.
Note: Throughout our discussion, we use a common layout with four Severity Levels and a 0-1-5-25 range of Severity Multipliers. Different systems of Severity Levels may be used as explained below in 2.2.3 Severity Penalty Multiplier.
2.1 Calculation Values
The sample scorecard in Figure 1 (download Excel scorecard from here) expresses the results for applying one possible metric to a specific evaluation task to a sample of segments (the size of which is stated in the Evaluation Word Count). Rows 29–35 list the selected Error Types, in this case the seven high-level error dimensions (MQM-Core).
The following values highlighted in Figure 2 play major roles in designing translation quality evaluation models. The abbreviations listed here are sometimes used when discussing formal equations.
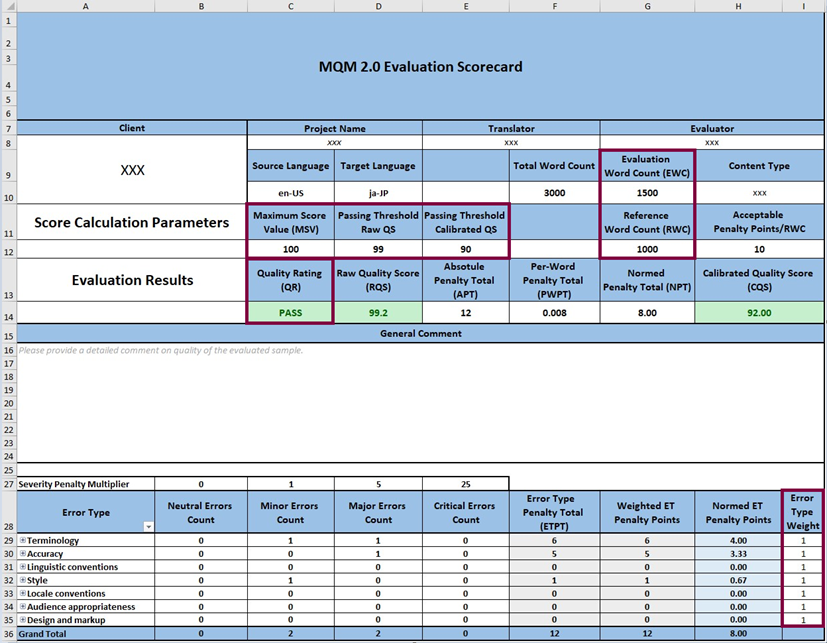
Figure 2: Most important calculation values
2.1.1 Evaluation Word Count / EWC
The Evaluation Word Count (Figure 2, Cell G10) is the word count of the text chosen for evaluation. As noted, the EWC can include the complete text (from one or more documents or collections of segments) or just a sample selection of text segments. The EWC is used in the calculation of the Quality Score (QS). The word count according to the ASTM standard is usually based on the source content.
NOTE: ISO 5060 cites the option to use character counts instead of word counts, or to use line counts that assume uniform characters per line. These approaches accommodate languages that sometimes have dramatically different word counts. ISO 5060 also uses count values for target language content word counts.
2.1.2 Reference Word Count / RWC
The Reference Word Count (Figure 2, Cell G12) is an arbitrary number of words in a hypothetical reference evaluation text. Implementers use this uniform word count to compare results across different projects. The RWC is often set at 1000.
2.1.3 Maximum Score Value / MSV
The Maximum Score Value of 100 is also an arbitrary value designed to manipulate the Quality Score in order to shift its value into a range which is easier to understand. It converts the score to a percentage-like value. Cell C12 in Figure 2 shows this value for the MSV.
2.1.4 Passing Threshold (PT)
The Passing Threshold is the score that defines the Pass/Fail limit. Scoring methods without calibration typically use values such as 0.99 OR 99 – depending on the scale used – as the Passing Threshold (Figure 2, Cell D12). If scoring with calibration is used, the implementer can define any number that is perceived to be visually meaningful, such as 95 or 90 (Figure 2, Cell E12).
2.1.5 Defined Passing Interval (DPI)
The Defined Passing Interval is the interval between the Maximum Score Value and the Passing Threshold. In these examples, Raw Scoring Models without calibration use a Defined Passing Interval of 1 (100-99) or 0.01 (1.00-0.99). In case of calibrated scores, the Defined Passing Interval is magnified to any reasonable range that allows for easy data analysis.
2.1.6 Final Quality Rating (Pass/Fail)
The Final Quality Rating (Figure 2, Cell C14) returns a PASS or FAIL quality rating of the evaluated content depending on whether the Quality Score is above or equals the Passing Threshold value (Pass) or is below it (Fail).
2.1.7 Error Type Weight (ETW))
Error Type Weights (ETWs) can be used to reflect the importance of Error Types, depending on their importance for a given project, project or content type. If the ETW is set to 1 for all Error Types (as in the sample scorecard in Figure 2, Cells I29-35), they are all equally important and result in the same number of penalty points if the Severity Level is the same. If implementers want to distinguish the Error Types by attaching more importance to some Error Types, they can apply different ETWs.
Applying different ETWs can be useful if certain Error Types should be given more prominence than others for a specific type of content. For example, for content with legal implications, Implementers may wish to give Accuracy errors higher weight than Style errors. This means that fewer Accuracy errors will be acceptable than Style errors. For example, if an Accuracy error should be counted as more important than a Style error, the implementers can give these Error Types different weights, such as 2 and 1 respectively. This means that a minor Accuracy error will result in more penalty points than a minor Style error. For the content related to the brand and marketing, the implementers can choose to give higher weights to Style or Audience Appropriateness errors to reflect their importance for the type of content.
2.2 Error Annotation Values
2.2.1 Error Type Number / ET No
The sample scorecard shown here reflects Error Type Names assigned to MQM-Core. Optionally, scorecard designers can select other values from MQM-Full or leave out unwanted values. The selected values are listed in the Error Types column (Column B) and associated with Error Type Numbers (ET Nos). Once evaluators have identified a potential translation error, they assign the error instance to one of the Error Types in 6-13.
2.2.2 Error Severity Level
The Error Severity Level reflects the effect of a particular error on the usability of the text.
Each error instance is annotated according to its Error Severity Level depending on the extent to which it poses a risk to the quality of the translation. This sample scorecard features four Severity Levels: Neutral, Minor, Major, and Critical. Three levels, or even two, are also common.
- Neutral Severity Level. The Severity Level of an error that differs from a quality evaluator’s preferential translation or that is flagged for the translator’s attention but is an acceptable translation.
- Minor Severity Level. The Severity Level of an error that does not seriously impede the usability, understandability, or reliability of the content for its intended purpose, but has a limited impact on, for example, accuracy, stylistic quality, consistency, fluency, clarity, or general appeal of the content.
- Majority Severity Level. The Severity Level of an error that seriously affects the understandability, reliability, or usability of the content for its intended purpose or hinders the proper use of the product or service due to a significant loss or change in meaning or because the error appears in a highly visible or important part of the content.
- Critical Severity Level. The Severity Level of an error that renders the entire content unfit for purpose or poses the risk for serious physical, financial, or reputational harm. In many systems, a single Critical Error would automatically trigger a Fail Rating.
2.2.3 Severity Penalty Multiplier / (SPM)
The Severity Levels in this sample MQM-based scorecard are identified by Severity Penalty Multipliers. These values can vary depending on implementers’ preference and needs, with the recommendation that there should be an exponential difference between values for Neutral, Minor, Major and Critical errors, for instance, in this case, of 0 – 1 – 5 – 25. This exponential relationship scale reflects the increased risk and impact between the Error Severity Levels. Custom Severity Penalty Multipliers may be required for a variety of reasons: for instance, in case character count per page is used instead of source word count.
The Severity Multipliers values times the number of errors at a given Severity Level and the Error Type Weight yields the totals for row values appearing in Figure 2, Cells G29-35.
2.3 Quality Measures and Totals
The scorecard in Figure 3 comprises the framework for the Raw Scoring Model. The set of framed scoring parameters (defined values and conditions) is used to calculate a Quality Score (or a set of comparative scores). These scores determine the final Quality Rating (Pass/Fail rating).
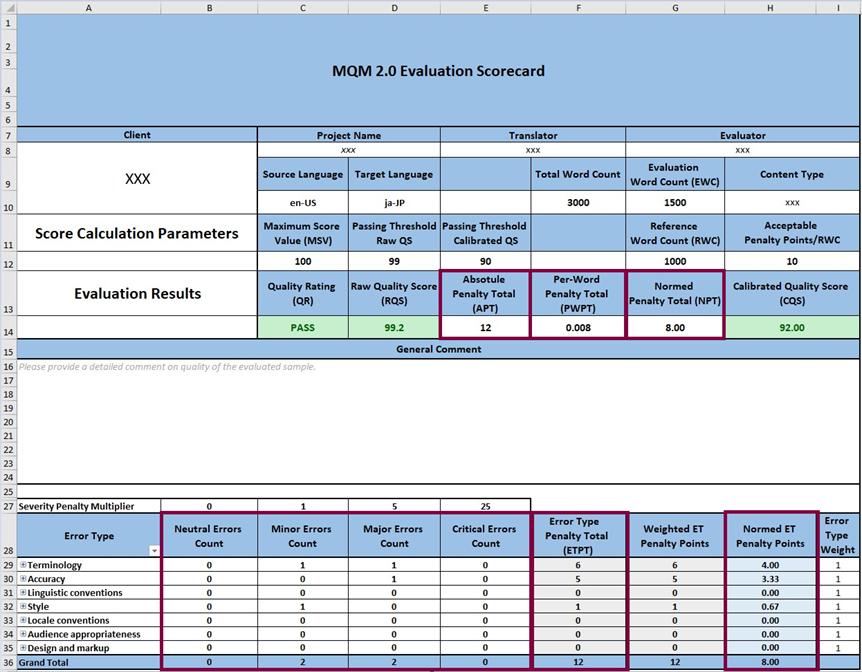
Figure 3: Quality Measures and Totals
2.3.1 Error Count (EC)
The Error Count for each Severity Level associated with a given error is multiplied by its respective Severity Multiplier.
2.3.2 Error Type Penalty Total (ETPT)
The Error Type Penalty Total (ETPT) is the sum of penalty points calculated for the individual Error Types annotated in the evaluated text. The error count for a specific Error Type and Severity Level is multiplied by the respective Severity Multiplier and Error Type Weight to obtain the Error Type Penalty Total.
For example, when using three severity levels, ETPT is defined as ((Minor Error Type count × Minor Severity Multiplier) + (Major Error Type count × Major Severity Multiplier) + (Critical Error Type Count × Critical Severity Multiplier)) × Error Type Weight.
2.3.3 Absolute Penalty Total (APT)
The Absolute Penalty Total is the sum of all Error Type Penalty Totals (Figure 3, Cell E12). APT is the most important value used for Quality Score calculation.
2.3.4 Per-Word Penalty Total (PWPT)
The Per-Word Penalty Total (Figure 3, Cell F12) is determined by dividing the Absolute Penalty Total by the Evaluation Word Count. The Per-Word Penalty Total is also one of the key values that contributes to the Raw Quality Score calculation.
2.3.5 Normed Penalty Total (NPT)
The Normed Penalty Total (Figure 3, Cell G12) represents the Per-Word Error Penalty total relative to the Reference Word Count.
Typically, 1000 is used as the arbitrary number to represent the Reference Word Count; therefore NPT is sometimes referred to as the Error Penalty Total per Thousand Words.
The Normed Penalty Total is obtained by multiplying the PWPT by RWC (NPT = PWPT × 1000 in our example). This is mathematically equivalent to (APT × RWC)/EWC.
2.3.6 Quality Score (QS)
The Quality Score is the primary quality measure of a translation product.
2.4 Methods for Calculating the Quality Score
There are different methods for calculating the Quality Score (Figure 4, Cells D14 and H14). These approaches differ in the logic behind the calculation.
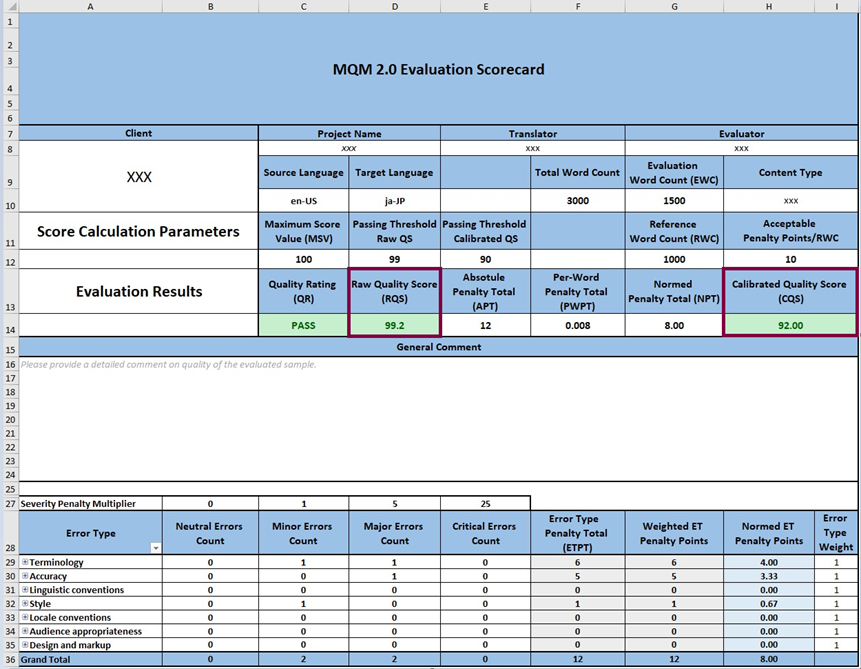
Figure 4: Quality Scores
2.4.1 Quality Score without Calibration (Raw Score)
The first option is to measure quality just by identifying the extent to which the evaluated content complies with the quality requirements. This is achieved by calculating the portion of the text with defects and subtracting this value from 100 to get the value which represents the error-free portion of the evaluated text.
Logically then, the Quality Score expresses the portion of the evaluated target content that is correct. In this example, the interval set for the “portion with defects” is 1. Hence, any quality score between 100–99 (1–0.99 respectively) produces the Pass rating.
2.4.2 Quality Score with Calibration
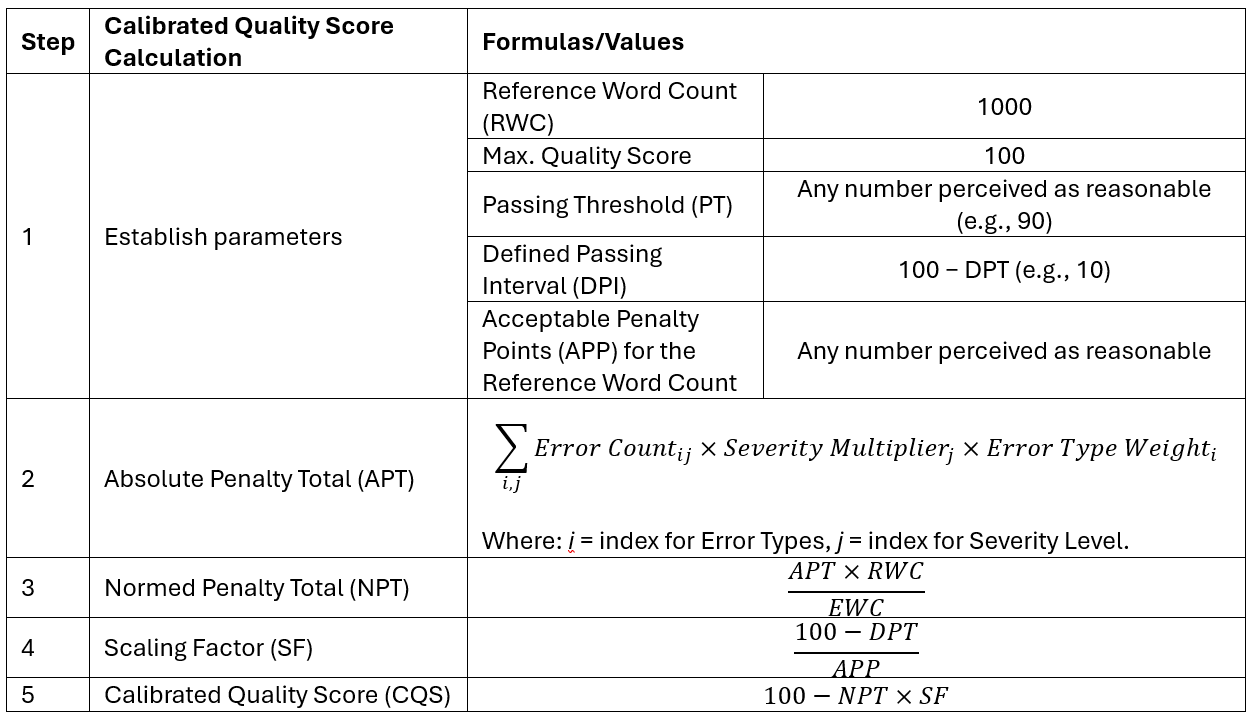
The second option is to calibrate the penalty points calculated for the evaluated sample against a preselected Passing Threshold or tolerance limit. To do so, implementers specify during the project specification stage how many penalty points they would deem to be still acceptable for the Reference Word Count (as noted above, typically, this would be penalty points per 1000 words) and associate this tolerance limit with the Passing Threshold.
Calibration is designed to express the scoring values in a way that stakeholders can interpret easily in line with their expectations and specifications. It takes the form of the Acceptable Penalty Points (APP) value for the Reference Word Count, which corresponds to the Passing Threshold. For example, a requester of legal translation might find that their Passing Threshold would be a Raw Score of 99.5 (e.g., five penalty points for a thousand-word Reference Word Count), while a requester for user-to-user technical help might accept a raw score of 97.2 (e.g., 28 penalty points for the same Reference Word Count).
However, relying on Raw Score calculations alone has drawbacks. For the legal example, the score hovers too close to 100, making it difficult to use the Raw Scores. In addition, if an organization has multiple content types, each with their own Passing Threshold, it can be difficult to track and apply the proper threshold to each one. Setting an acceptance threshold using Raw Scores is challenging when varying scores end up looking very close to each other, as such acceptance thresholds are not necessarily intuitive. The threshold may even turn out to be a complex fractional value, which means that simply scaling the Raw Score does not solve this problem.
To address these problems, the next step in calibration is to express the Raw MQM Score in more ergonomic terms. In its raw form, a score is initially calculated as described above. It is then converted to a Calibrated Score scale using a Scaling Factor, described below.
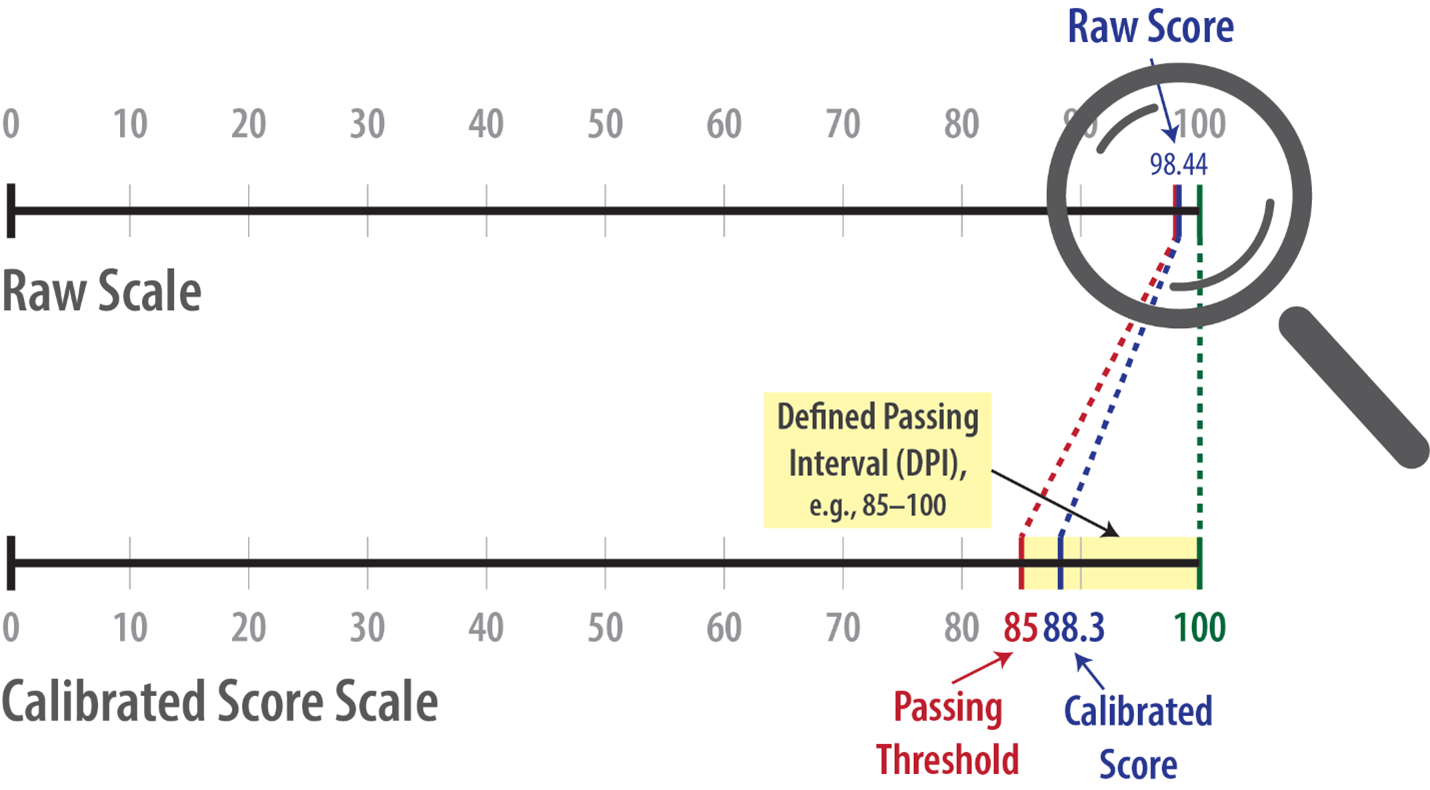
Figure 5: Projecting the small window in the Raw-Score scale by magnifying the Defined Passing Interval (DPI) to the scale of the Calibrated Score; the Passing Threshold is arbitrary based on the relevant values that apply for a specific context.
The process of calibration acts like a magnifying glass for viewing the otherwise very small or inconsistent ranges of acceptance close to 100. This approach makes the quality rating easier to use and understand, highlighting differences in translation quality for evaluated texts more clearly.
2.5 Score Calculations
2.5.1 Scoring Method without Calibration
Calculating scores without calibration uses the following steps. For a list of all parameters and their abbreviations, see Appendix: Scoring Model Parameters.
2.5.2 Scoring Method with Calibration
The Scoring Method with Calibration enables implementers to account for the error tolerance for a specific word count (Reference Word Count) and to link it to the pre-defined Passing Threshold (PT), against which the Pass rating is determined. For a list of all parameters and their abbreviations, see Appendix: Scoring Model Parameters.
The scoring formula for calculating the quality score with calibration works with the standard calculation values, such as Evaluation Word Count, Absolute Penalty Total and Normed Penalty Total. However, a few additional values and parameters have to be defined. Those are used to pre-define the specified acceptance criteria (the error tolerance) and to link these criteria to a scale that should be understandable or appropriate for all stakeholders.
The following values used in the score calculation above are pivotal for a score calibrated with respect to a predefined Passing Threshold:
2.5.2.1 Acceptable Penalty Points (APP) for the Reference Word Count
Penalty points deemed as still acceptable for a certain volume of text, typically for the Reference Word Count of 1000 words.
Typical questions to ask when defining the Acceptable Penalty Points are:
- What is the number of Minor errors that would still be a Pass for a sample of 1000 words?
- What is the number of Major errors that would still be a Pass for a sample of 1000 words?
In simple terms, the APP reflects the error count that stakeholders would still consider to be acceptable for a given word count (typically 1000 words) provided that the Minor Error Weight is 1.
In the current example, the acceptable error tolerance is defined as 10 minor errors OR 2 major errors per 1000 words, which yields a Raw Quality Score of 99. If the Normed Penalty Total calculated for the evaluation sample is greater than 10 penalty points, the defined Passing Threshold has been exceeded and the evaluation result is FAIL.
2.5.2.2 Passing Threshold (PT)
A number perceived as an intuitively reasonable Passing Threshold.
Calibration enables the determination of a Passing Threshold that is psychologically meaningful to stakeholders. This number typically is any reasonable number in the range of 0-100. It represents the Passing Threshold score that is linked to the pre-set count of penalty points for the reference word count, i.e. the initially defined error tolerance for a certain unit of text.
Calibration transforms the narrow passing interval obtained using the raw, uncalibrated score to a wider and more interpretable interval, which acts analogous to a magnifying glass.
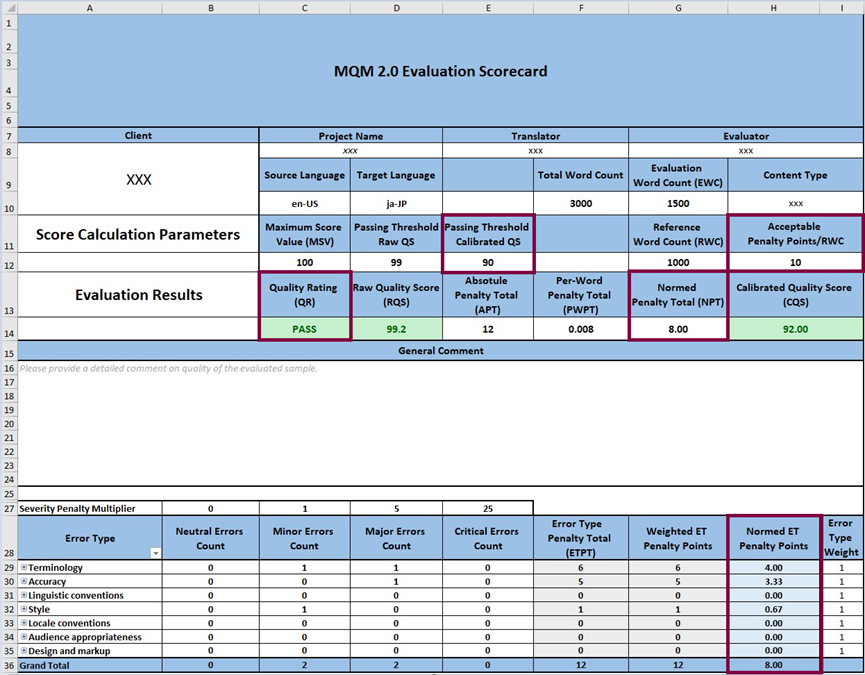
Figure 6: In this example, 90 is defined as the Passing Threshold. This score is achieved if the Normed Penalty Total for the Evaluation Word Count is 10. If it is greater than this value, the Quality Score is a number below the Passing Threshold of 90, and the evaluation result is FAIL.
2.5.2.3 Scaling Factor (SF)
Parameter to scale the Acceptable Penalty Points (APP) for the reference word count across the Defined Passing Interval (DPI).
In the Scoring Method with Calibration, the Defined Passing Interval is calculated as the Δ between the Maximum Score Value and the pre-defined Passing Threshold.
In this example, the Scaling factor is 1. First, the Defined passing interval is calculated: 100-90=10. Then, the 10 acceptable penalty points per the reference word count of 1000 are distributed across the Defined passing interval of 10, which yields 1: 10/10=1).
The two scoring methods – with and without calibration – serve different purposes. Non-calibrated scores represent the raw results of an evaluation task. Calibrated scores are adjusted to meet stakeholder requirements but may not always be comparable across evaluation tasks or organizations. For example, a translation service provider is likely to use different calibrations for different clients or use cases. For contexts where scores need to be directly comparable across use cases, non-calibrated scores are more likely to be useful.
Parameter or variable name (full form) | Abbreviation | Unit of measurement |
Evaluation Word Count | words | |
Reference Word Count | words | |
Error Type Weight | – | |
Severity Penalty Multiplier | – | |
Absolute Penalty Total | total penalty points | |
Error Type Penalty Total | penalty points per Evaluation Word Count | |
Per-Word Penalty Total | penalty points per evaluated word | |
Normed Penalty Total | penalty points per Reference Word Count | |
Scaling Factor | – | |
Defined Passing Interval | units on calibrated scale | |
Quality Rating | QR | – |
Acceptable Penalty Points for the Reference Word Count | penalty points per evaluated word | |
Passing Threshold | – | |
Quality Score Raw Quality Score Calibrated Quality Score | RQS CQS | – |