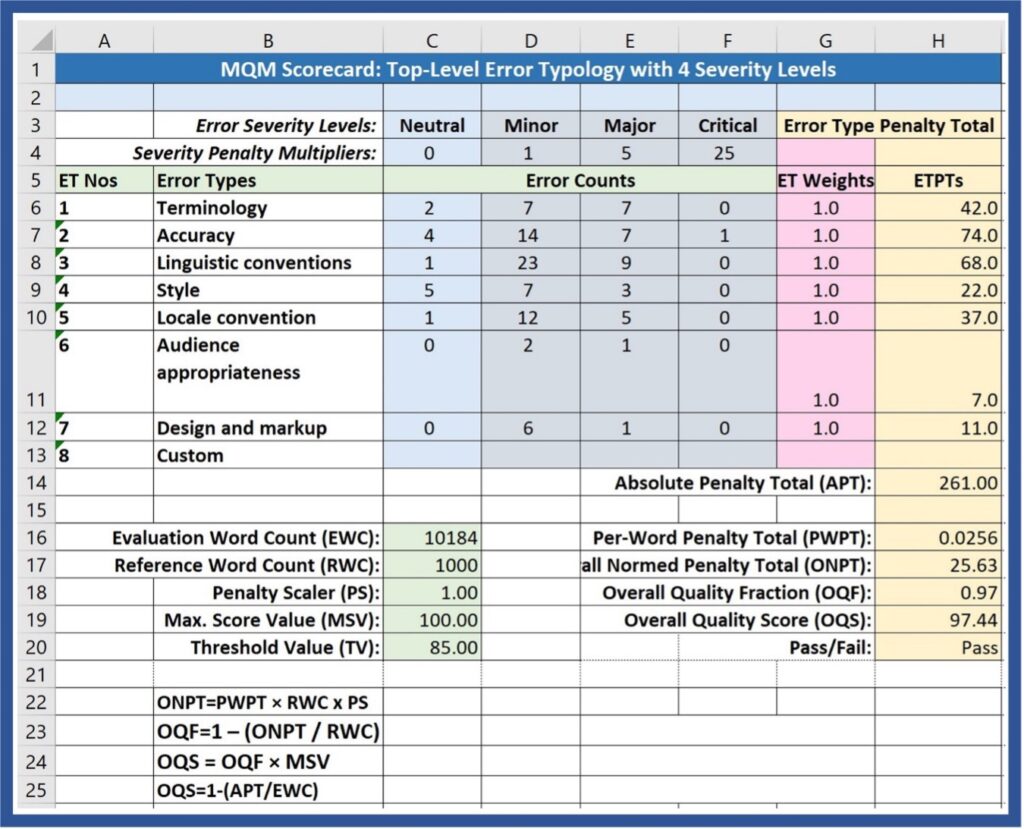
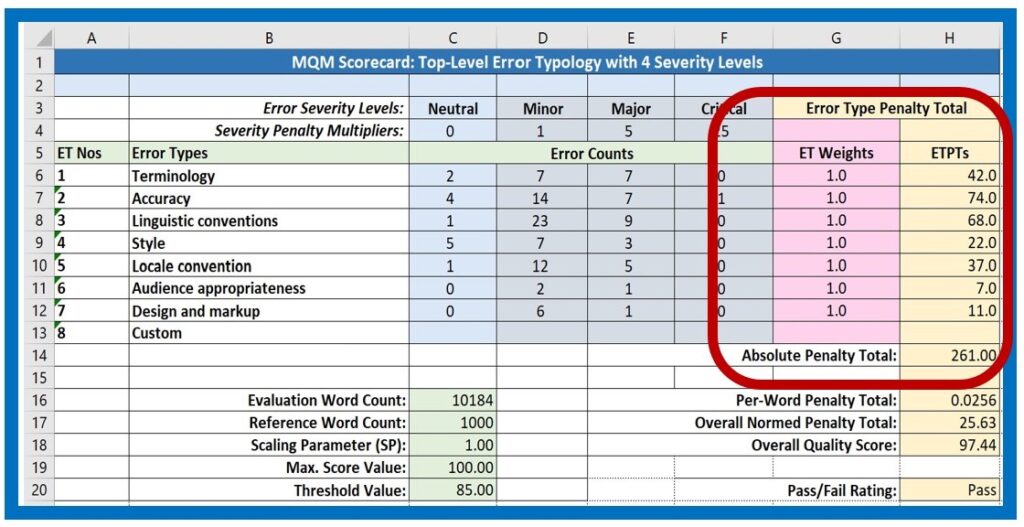
The simple scorecard shown here in Figure 1 represents the seven top-level error dimensions from the MQM Error Typology. The “Top-Level_Simp” spreadsheet of the downloadable ScoreCard_Model.xslx file reflects the simple example shown here.
Setting Up an Existing Scorecard
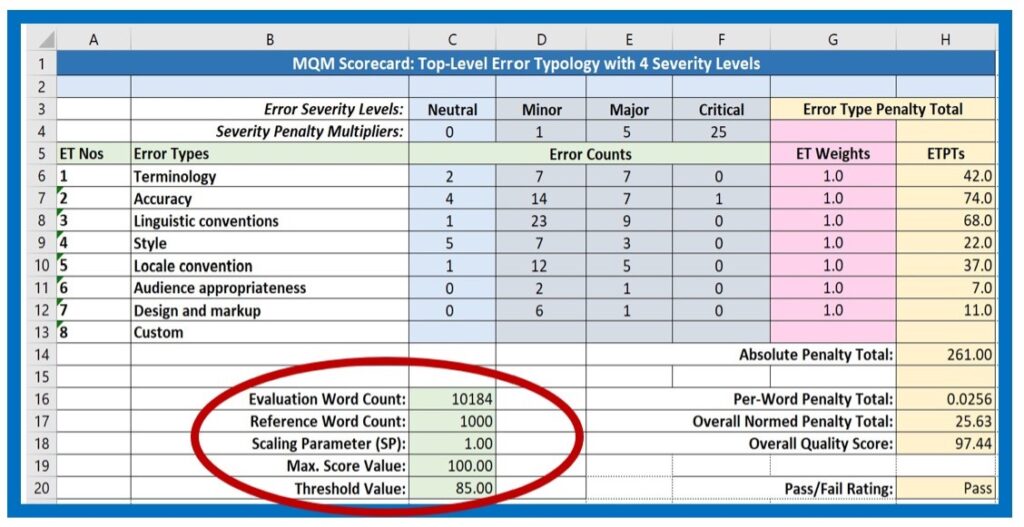
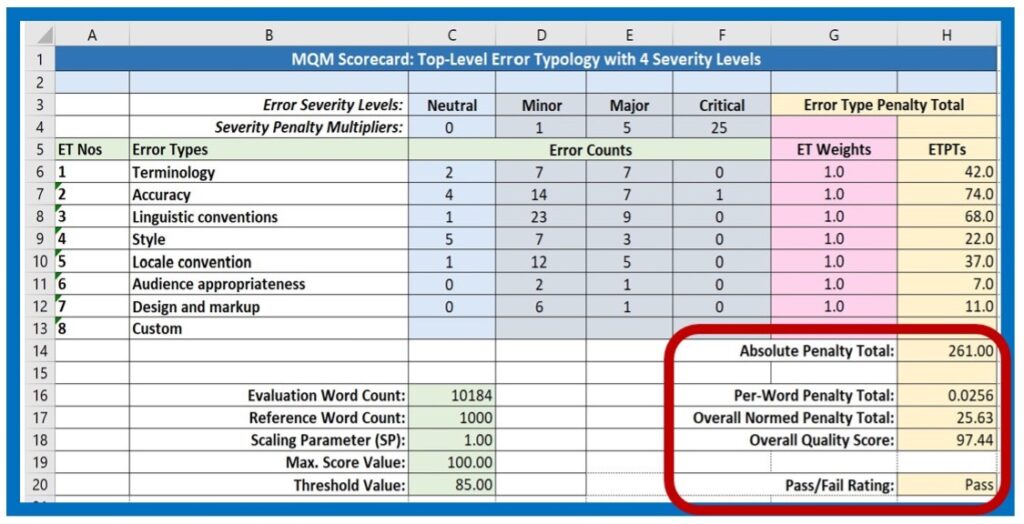
When beginning an evaluation project using an existing scorecard, the first step is to enter the Evaluation Word Count (EWC) in the scorecard, shown in Cell C16 in Figure 2. If you are using a separate spreadsheet scorecard, this value should be taken from the CAT tool source or target text word count calculation. If you are working with a stand-alone application or a utility that is integrated into your Translation Environment Tool (TenT), the system may be designed to insert this value automatically.
ISO 5060 shows scorecard examples that use EWC values based on the translation target text, whereas the ASTM document suggests the use of the source text word count. Different stakeholders can prefer one or the other. The choice of word count value to use for a given project depends on stakeholder needs and preferences.
The Reference Word Count (EWC, 1000) and the Maximum Score Value (MSV,100) remain the same, and the Scaling Parameter (SP), which is set here to “1”, is only changed if your system is designed to alter the scale for different languages or types of projects.
If your evaluation environment uses a standard Threshold Value (TV), this value may not need to be entered or changed. It is wise to determine the threshold value or values based on analysis of the kinds of texts that are commonly translated in your context and the level of quality expected by stakeholders. For instance, careful human translation of advertising texts will probably require a higher threshold value than bulk machine translation of masses of web data. During set-up, evaluators should choose the Threshold Value appropriate for a given project. Do note: the arbitrary value of “85” entered in the sample scorecard in Figure 2 is in no way a suggestion.
The Role of Evaluators
When evaluators identify an error instance in a translated text for evaluation, they assign the error to an error type and the appropriate severity level. The way this assignment takes place may vary depending on the translation environment. Many evaluators enter values manually in a separate Excel spreadsheet, while others may work with a stand-alone evaluation tool. Ideally, a CAT tool might enable evaluators to automatically annotate errors in a scorecard integrated into the Translation Environment Tool, but this is not always the case. Once a tally has been entered, evaluators move on to the next error. The rest of the process is automatic and happens in real-time as the evaluator finishes the evaluation, at which time the values for the quality measures appear at the bottom of the scorecard.
Automatic Calculations
Error Type Penalty Totals
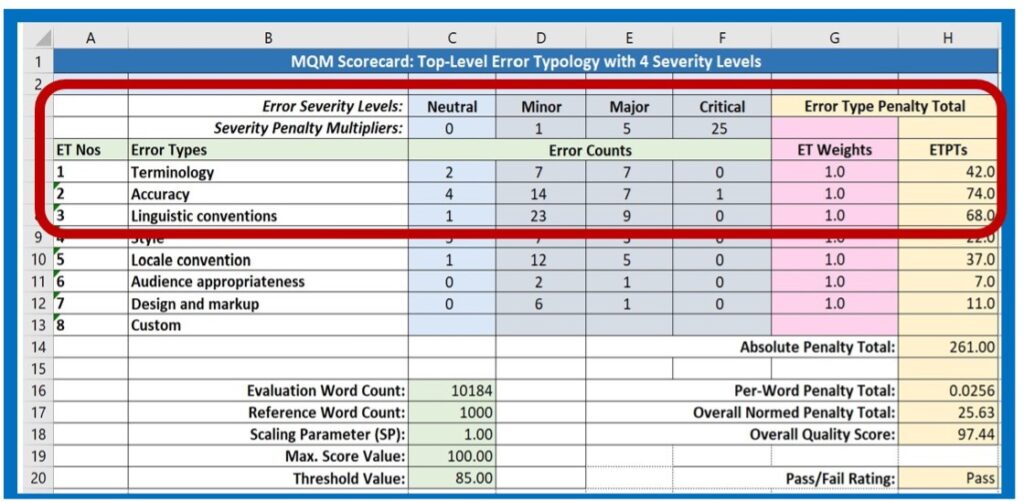
As noted, the math component of the scorecard automatically calculates all the values and scores. First, in the metric part of the scorecard, it multiplies the Error Count in any given cell times the Severity Multiplier value for that cell, then adds up the sum of the intermediate products for that row in the table to yield the Error Type Penalty Total for that row. Some people like to see the intermediate products, but many evaluators find them distracting. There is even some evidence that seeing them appear during the annotation process can prejudice the ongoing penalty assignment process. The sample scorecard used here is designed to be very simple and does not show them.
The Error Type Weight values for the sample shown here are set to 1.0, which means that all the error type values are used as their raw sums and all are treated equally. The ET weight can be varied, however, if scorecard designers wish to give additional weight to some error types, for instance Style in a highly creative text, or Terminology in a very difficult technical document.
The Error Type Penalty Total for Error Type Number 2, Accuracy, in Figure 1 is determined as follows: 2 x 0 = 0; 14 x 1 = 14 (x 1); 7 x 5 = 35 (x 1); 1 x 25= 25 (x 1); (0 + 14 + 35+ 25) x 1 = 74
Absolute Penalty Totals
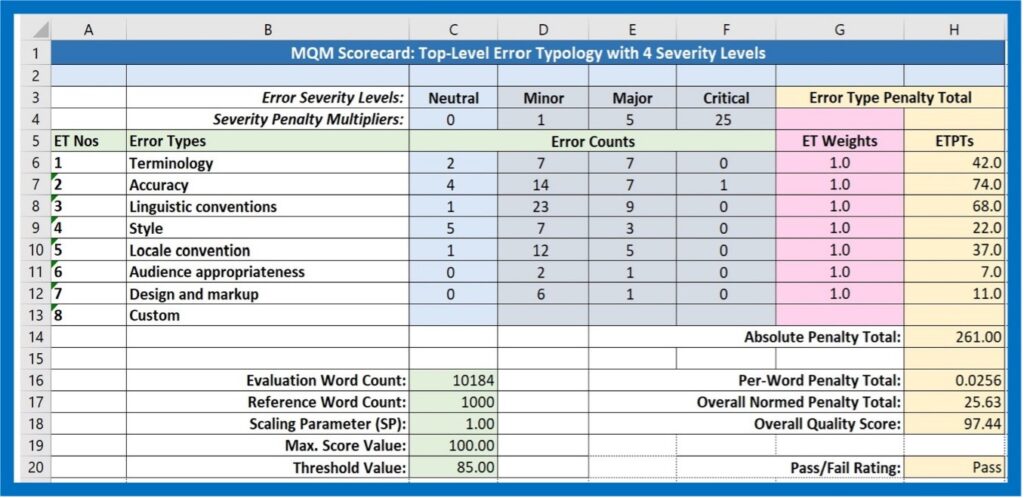
The math function for the metric maintains an ongoing sum of all the Error Type Penalty Totals, which are reported in the Absolute Penalty Total cell, H14 in this example. This value forms the base for the remaining calculations performed by the scoring model.
MQM Quality Measures
As an expression of the scoring model used in this example, the scorecard calculates the following quality measures based on the Absolute Penalty Total and the calculation values introduced above.
Per-Word Penalty Total
The Per Word Penalty Total (PWPT, H16) is the quotient of the Absolute Penalty Total (APT) divided by the Evaluation Word Count (EWC). The Per-Word Penalty Total already provides a global measure that can be compared to other translation evaluation projects.
Overall Normed Penalty Total
The Per-Word Penalty Total, although it is already comparable to all Per-Word Penalty Totals, is usually very small and doesn’t really fit into any customary mathematical frameworks. The goal of the measures is to arrive at a score that resembles other scores and grading procedures that are familiar to many people from traditional assessment and evaluation systems.
The Overall Normed Penalty Total (ONPT, H17) moves the measured value into a higher range by multiplying the Per-Word Penalty Total times the Reference Word Count (C 17) to arrive at the value shown in Cell H17. In the actual equation, the Scaling Parameter, here with the value of “1,” is used as an additional multiplier, which of course does not change the score. The Scaling Parameter can, however, be adjusted if there is a desire to shift (scale) the final values produced by the scorecard in order to reflect special factors, such as differences in difficulty or resources for the translation of different languages, or differences in expectations for different kinds of projects.
Overall Quality Score
The Overall Normed Penalty Score (ONPS, H18) is then determined by subtracting the Per-Word Penalty Score from the number “1” and multiplying by the Maximum Score Value (MSV, C19) of “100” to yield a number that resembles a percentage. In the equation, the value of the Scaling Parameter (which is not actually related to the value “1” used as the subtrahend in the equation) is multiplied times the Per-Word Penalty Score, but this has no affect on the result of the equation if the Scaling Parameter is equal to “1” as it is here.
First of all, a critical error would automatically relegate this evaluation to a “Fail” rating. Since the scorecard performs its calculations in real-time as error instances are tallied during the error annotation process, the Overall Quality Score is immediately available upon completion of the annotation process. The evaluator can then compare it to the Threshold Value and determine whether the translation product “passes” the evaluation or not (in the absence of critical errors). Of course, this result is just one application for scorecard values. Based on analysis of the error types and their characteristics in the target text itself, it is possible to apply the evaluation to a Root Cause analysis in order to implement measures aimed at the continuous improvement of the process.
Designing Individual Scorecards
Despite the use of this model for our explanations, a scorecard limited to the top dimensions may not meet all needs. The Scorecard Design page outlines procedures for designing customized solutions.